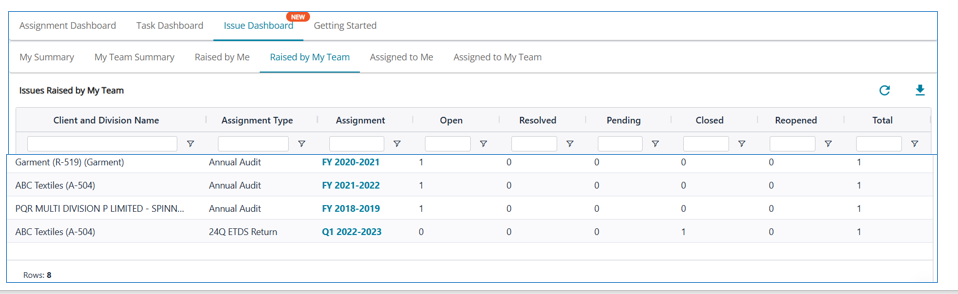
Issues DashBoard
Issue Dashboard
The Issue Dashboard provides a consolidated and intuitive view of all issues across assignments, helping teams monitor workload, track progress, and identify bottlenecks efficiently.
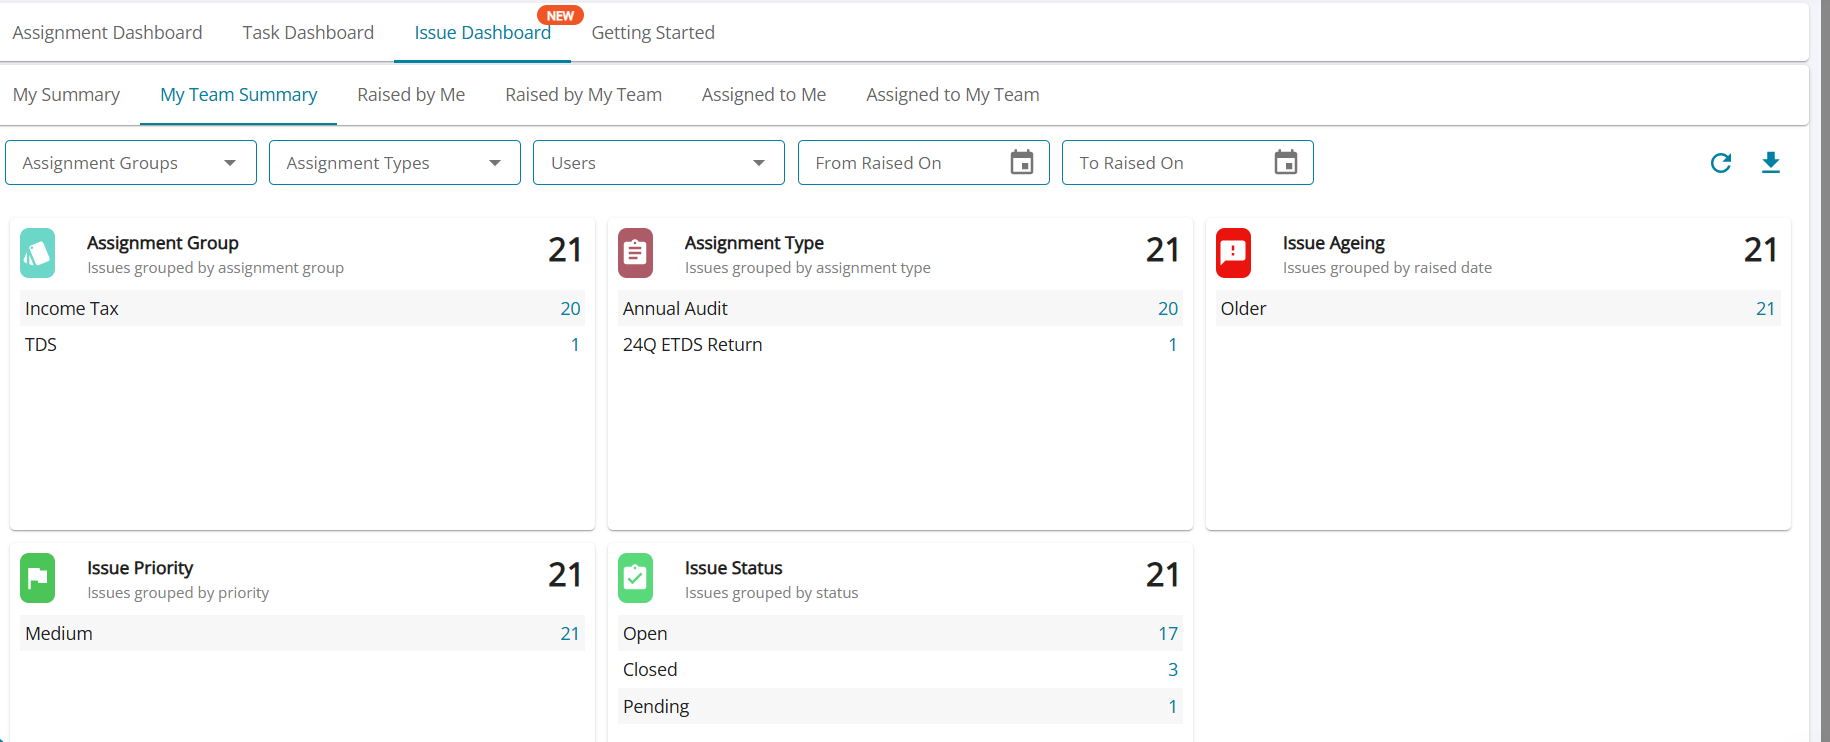
Overview of the Dashboard
The dashboard is designed to give users a quick snapshot of issue distribution using grouped summary cards. Each card highlights the total number of issues and provides a categorized breakdown for deeper insights.
At the top, users can navigate across different views:
(i) My Summary
(ii) My Team Summary
(iii) Raised by Me
(iv) Raised by My Team
(v) Assigned to Me
(vi) Assigned to My Team
This allows users to switch perspectives depending on whether they want an individual or team-level view.
Filters and Controls
The dashboard includes flexible filtering options to refine the data displayed:
Assignment Groups – Filter issues by specific groups (e.g., Income Tax, TDS)
Assignment Types – Narrow down by type (e.g., Annual Audit, Returns)
Users – View issues related to specific team members ( only on My Team's Summary)
Date Range (From / To Raised On) – Focus on issues raised within a defined timeframe